Enterprise network management is the ongoing process of monitoring, configuring, securing, troubleshooting, and improving the infrastructure that connects an organization’s users, devices, applications, sites, and cloud services. It combines operational processes with management systems that collect network data, control configurations, identify faults, and help teams keep services available and predictable.
A modern enterprise network may span offices, data centers, cloud services, wireless networks, remote users, software-defined wide-area network (SD-WAN) connections, and Internet of Things (IoT) devices. That makes network management broader than watching a dashboard or checking whether a router is online.
What Is Enterprise Network Management?
Network management is the set of processes and capabilities used to provision, configure, monitor, operate, maintain, and optimize a network. A network management system, often shortened to NMS, provides some of the tools administrators use to perform those jobs centrally. Cisco describes network management as covering both the processes and platforms used to configure, monitor, and optimize network performance.
The distinction between the discipline and the software matters. Installing an NMS does not automatically create a mature network-management practice. People still need to know what assets exist, which services matter most, what normal behavior looks like, who can make changes, how faults are escalated, and how a change is verified after deployment.
For example, consider an organization with a headquarters building, three branch offices, cloud-hosted applications, Wi-Fi, remote employees, and network-connected cameras. Its operations team needs more than device availability. It needs an inventory of those assets, visibility into their relationships, performance measurements, configuration history, access controls, alerts, and a process for responding when something changes or fails.
The scope is also broader than a traditional office local area network. NIST notes that enterprise environments have changed because organizations increasingly use multiple cloud services, geographically distributed IT resources, and distributed application architectures. Those changes increase the importance of managing connectivity and security across multiple boundaries rather than treating the enterprise as one protected internal network.
Network Management vs Network Monitoring
Network monitoring and network management are closely related, but they are not interchangeable. Monitoring observes and reports what is happening. Management uses that visibility as part of a broader process that can also include provisioning, configuration, policy enforcement, troubleshooting, remediation, and optimization.
For example, detecting that packet loss has increased on a branch WAN link is monitoring. Investigating whether the problem comes from the carrier, interface errors, congestion, or a recent configuration change, then correcting the cause and confirming that service has recovered, is network management.
Observability is another related concept. It emphasizes combining multiple signals and contextual relationships to understand why a system behaves a certain way, especially when one metric or alert does not reveal the cause. A management platform can incorporate monitoring and observability capabilities without making those terms synonymous.
| Concept | Primary purpose | Typical outputs | Typical operational response |
|---|---|---|---|
| Network monitoring | Observe network health, availability, traffic, and performance. | Metrics, status views, dashboards, events, and alerts. | Investigate a detected condition. |
| Observability | Use multiple signals and context to explain system behavior. | Correlated telemetry, dependencies, trends, and diagnostic context. | Narrow down why a condition is occurring. |
| Network management | Operate and control the network throughout its lifecycle. | Monitoring data, policies, configurations, topology, workflows, and operational records. | Configure, troubleshoot, remediate, optimize, and govern. |
This distinction is useful when evaluating tools. A product described as a network monitoring system may focus on collecting and analyzing health and performance data while providing fewer configuration or policy functions. HPE’s current explanation of network monitoring similarly distinguishes monitoring from the broader work of configuration, provisioning, policy enforcement, and optimization.
The Core Functions of Network Management
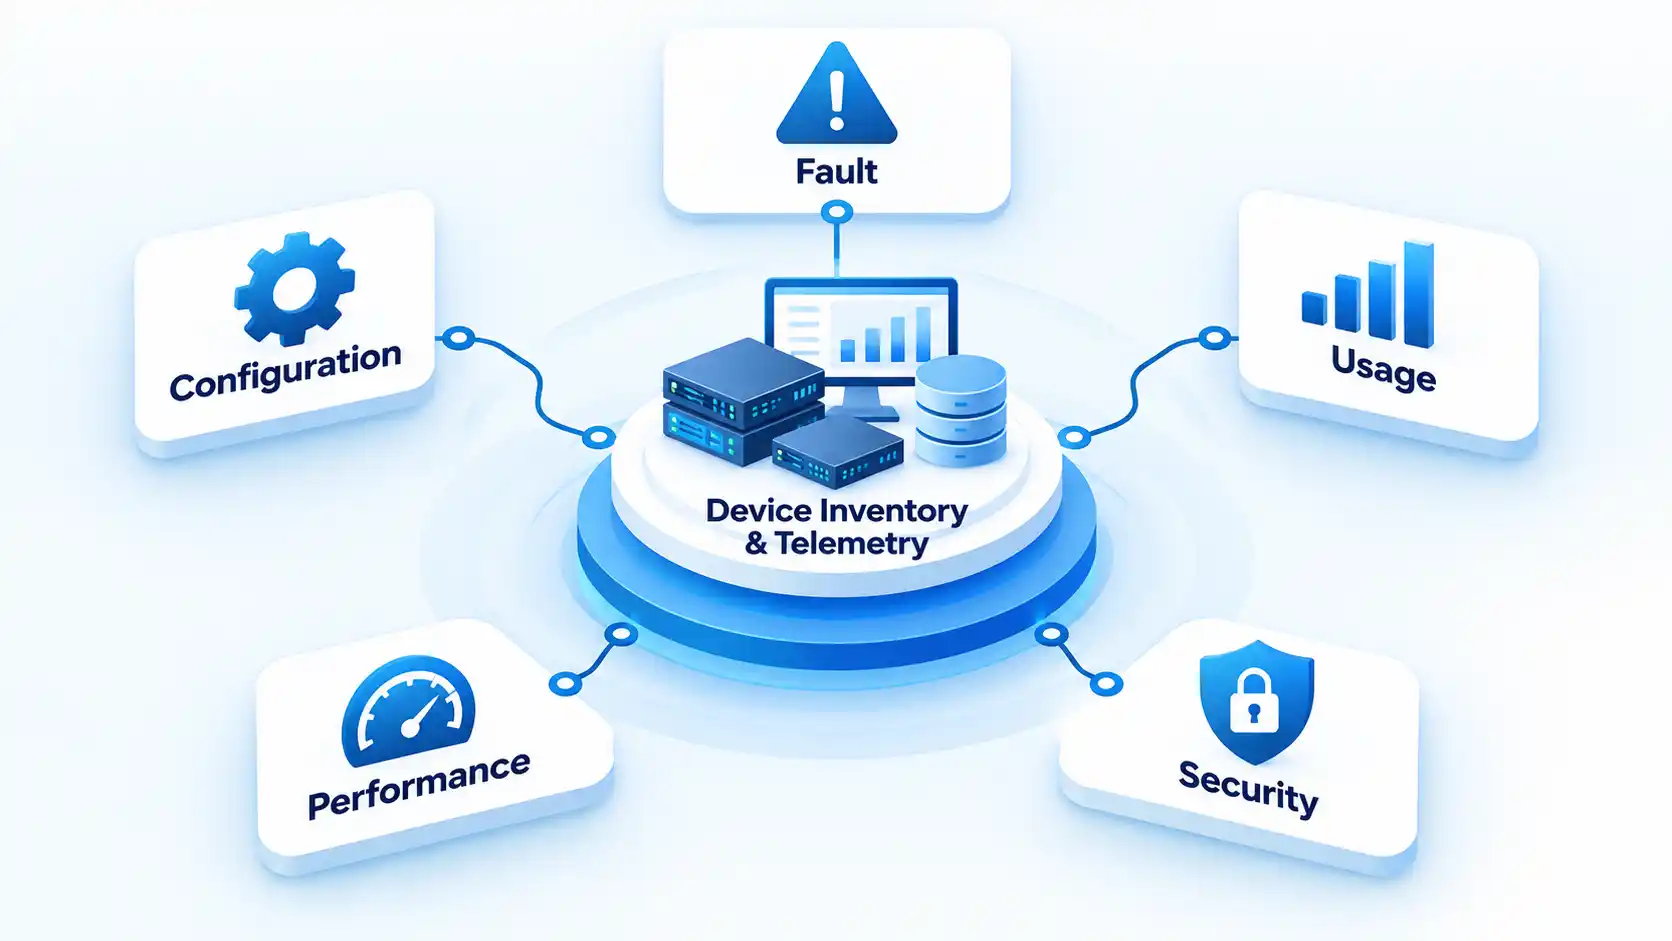
A useful way to organize network-management responsibilities is the FCAPS framework: fault, configuration, accounting, performance, and security management. HPE’s current network-management overview uses these five functions as a practical framework. Modern operations can also extend into areas such as topology discovery, automation, cloud management, and user-experience monitoring.
Fault Management
Fault management focuses on detecting failures, isolating their likely causes, restoring service, and recording what happened. A fault might be a failed switch, an unreachable access point, a flapping interface, a lost WAN connection, or a service dependency that has become unavailable.
The challenge is not simply generating alerts. Large environments can produce many related events from one underlying failure. If a branch router fails, for example, the management system may also report dozens of downstream access points and switches as unreachable. Useful fault management tries to distinguish the primary event from its consequences so operators are not forced to investigate every alert independently.
Configuration Management
Configuration management controls how network settings are created, changed, recorded, backed up, and restored. It can cover router and switch configurations, wireless policies, firewall rules, interface settings, software versions, and other device parameters.
A mature change process should make it possible to answer basic questions: What changed? Who changed it? Was the change approved? What was the previous state? Can the previous configuration be restored if the deployment fails?
Cisco’s current secure-operations guidance describes configuration management as a process in which changes are proposed, reviewed, approved, and deployed, with configuration archives supporting rollback and security auditing.
Accounting and Usage Management
The accounting part of FCAPS concerns how network resources are used. Depending on the organization, that might involve recording bandwidth consumption, allocating shared resources, understanding which users or departments consume capacity, or supporting cost allocation and capacity planning.
It does not necessarily mean financial accounting software. The practical goal is to understand where network resources are going and whether usage patterns justify changes in capacity, policy, or service allocation.
Performance Management
Performance management asks whether the network is delivering an acceptable service, not merely whether its devices are powered on. Common measurements include latency, packet loss, throughput, utilization, interface errors, CPU use, memory use, wireless conditions, and application or user-experience indicators.
Context matters. An interface running at high utilization is not automatically defective, and an isolated latency spike may not justify an incident. A baseline is a record of the normal range or pattern for a useful metric over time. Teams can compare current conditions with those baselines, service priorities, and trends to distinguish expected peaks from conditions that are actually harming users or applications.
Security Management
Security management covers the controls required to operate network infrastructure without exposing administrative access, configurations, credentials, telemetry, or network policies unnecessarily. It therefore extends far beyond installing antivirus software.
The management plane is the set of device functions and traffic used for administration, configuration, maintenance, and monitoring. It deserves particular attention because compromising administrative access can affect control of the device itself. Cisco recommends protecting management access, using secure management protocols where possible, and securing operational services such as SNMP, syslog, authentication, and remote administration.
For broader operational security planning, administrators can also consider log monitoring, configuration changes, firewall management, and network access controls together rather than treating each as an isolated task.
How Network Management Systems Collect and Use Data
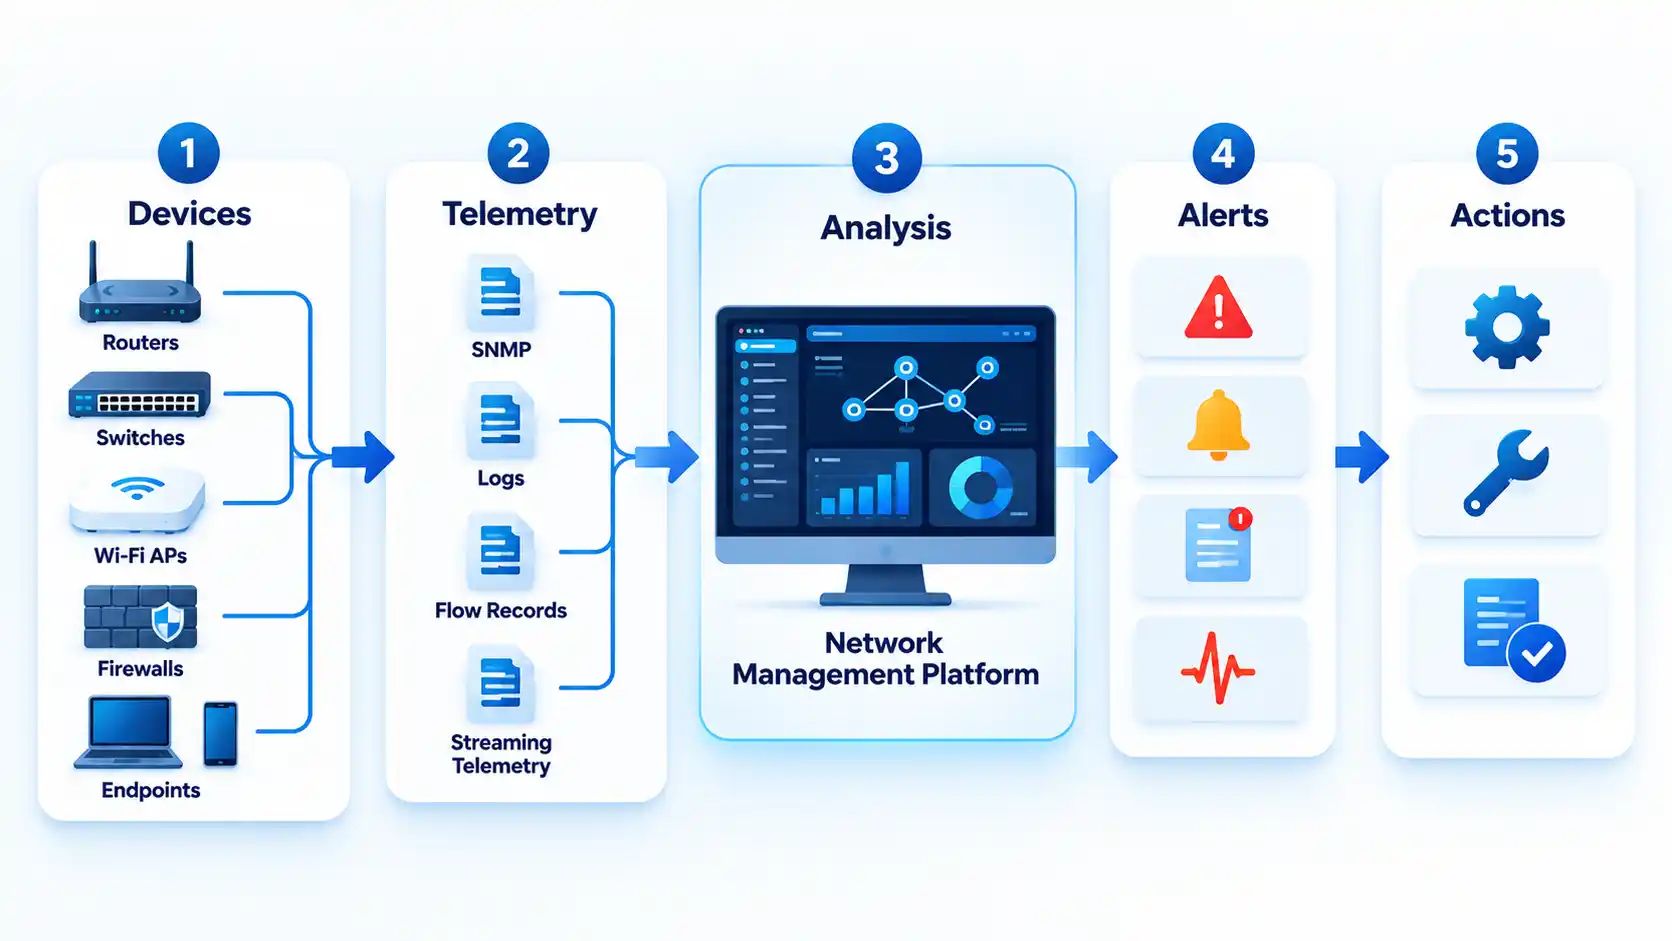
A management system can only act on what it can discover or receive. Modern platforms therefore gather information from routers, switches, access points, firewalls, endpoints, controllers, cloud-connected systems, and other infrastructure through several mechanisms. Telemetry is the operational data those systems collect or receive about device state, traffic, performance, and events.
In practice, organizations may use centralized network management software alongside device-native interfaces and other operational systems to collect inventory, telemetry, alerts, and configuration data.
Device Discovery and Inventory
Inventory establishes what the organization actually operates. Useful records can include device identity, address, role, interfaces, software or firmware version, physical or logical location, neighboring devices, and ownership information.
Discovery can also help build topology maps that show how devices and services depend on one another. That context becomes valuable during an outage because an operator can distinguish one failed upstream device from many downstream systems that are merely unreachable because of it.
IoT can make inventory more complicated because the network may include sensors, cameras, controllers, gateways, and other embedded devices in addition to conventional computers. Understanding how IoT devices produce and transmit telemetry can help when those devices become part of the managed estate.
SNMP, Logs, Flows, and Streaming Telemetry
Simple Network Management Protocol (SNMP) has long been used to obtain status and performance information from network devices. A management system can query supported information from devices using SNMP. Cisco’s current overview identifies SNMP as a widely supported collection mechanism used by network-management systems.
Logs serve a different purpose. Devices generate operational and security event records that can help administrators reconstruct changes, failures, and access activity. Centralizing the logs that matter to an investigation can make it easier to correlate events across several devices rather than examining each device independently.
Flow records provide information about traffic conversations rather than only the overall utilization of a link. They can help operators identify which communications are contributing to traffic volume when a utilization graph alone does not explain the cause.
Streaming telemetry allows network elements to transmit selected operational measurements to a collector on an ongoing basis. Cisco’s network-management overview describes SNMP and streaming telemetry as two network-data collection approaches. The appropriate mechanism depends on equipment support, scale, the management platform, and the operational question, so an enterprise may use several collection methods together.
Model-driven management adds another layer. The IETF NETCONF specification defines mechanisms for retrieving and manipulating network-device configuration through remote procedure calls. YANG 1.1 is a standardized language for modeling configuration data, state data, remote procedure calls, and notifications. These standards are especially relevant where automation needs structured, machine-readable models rather than ad hoc command parsing.
From Telemetry to Alerts and Diagnosis
Collection is only the first stage. A management platform may normalize incoming data, associate it with known devices and interfaces, compare measurements with thresholds or baselines, correlate related events, and surface conditions that need attention.
The quality of this process matters more than raw data volume. Collecting metrics that nobody uses can add operational noise without improving decisions. A better approach starts with specific questions: Which services must remain available? Which failures need immediate escalation? Which measurements help distinguish congestion from a physical fault? Which configuration changes create meaningful risk?
What Should an Enterprise Actually Monitor?
The most useful monitoring strategy starts with the service or operational question and then chooses measurements that answer it. A single universal threshold rarely works across every device, site, link, and application.
| Signal category | What it can reveal | Important caveat |
|---|---|---|
| Availability | Whether critical devices, interfaces, paths, or services are reachable and functioning. | An unreachable downstream device may be a consequence of an upstream failure rather than a separate incident. |
| Performance | Latency, packet loss, throughput, utilization, errors, and other indicators of service quality. | A threshold needs context from the link, application, site, and normal workload. |
| Device health | CPU, memory, temperature, power, storage, or hardware status where supported and relevant. | A high value does not always mean user impact; trends and duration matter. |
| User and application experience | Whether people can reach important services with acceptable response and connection quality. | Good device health does not guarantee good application experience. |
| Change and security signals | Configuration changes, authentication failures, unexpected devices, policy drift, or suspicious traffic patterns. | Security meaning depends on identity, asset role, approved changes, and surrounding events. |
HPE’s network-monitoring guidance identifies bandwidth utilization, CPU and memory usage, packet loss, latency, device status, authentication failures, and client connection success among useful operational signals. The goal is not to collect every possible metric. Each signal should support a decision, alert, capacity assessment, or investigation that someone can act on.
How to Build an Enterprise Network Management Practice
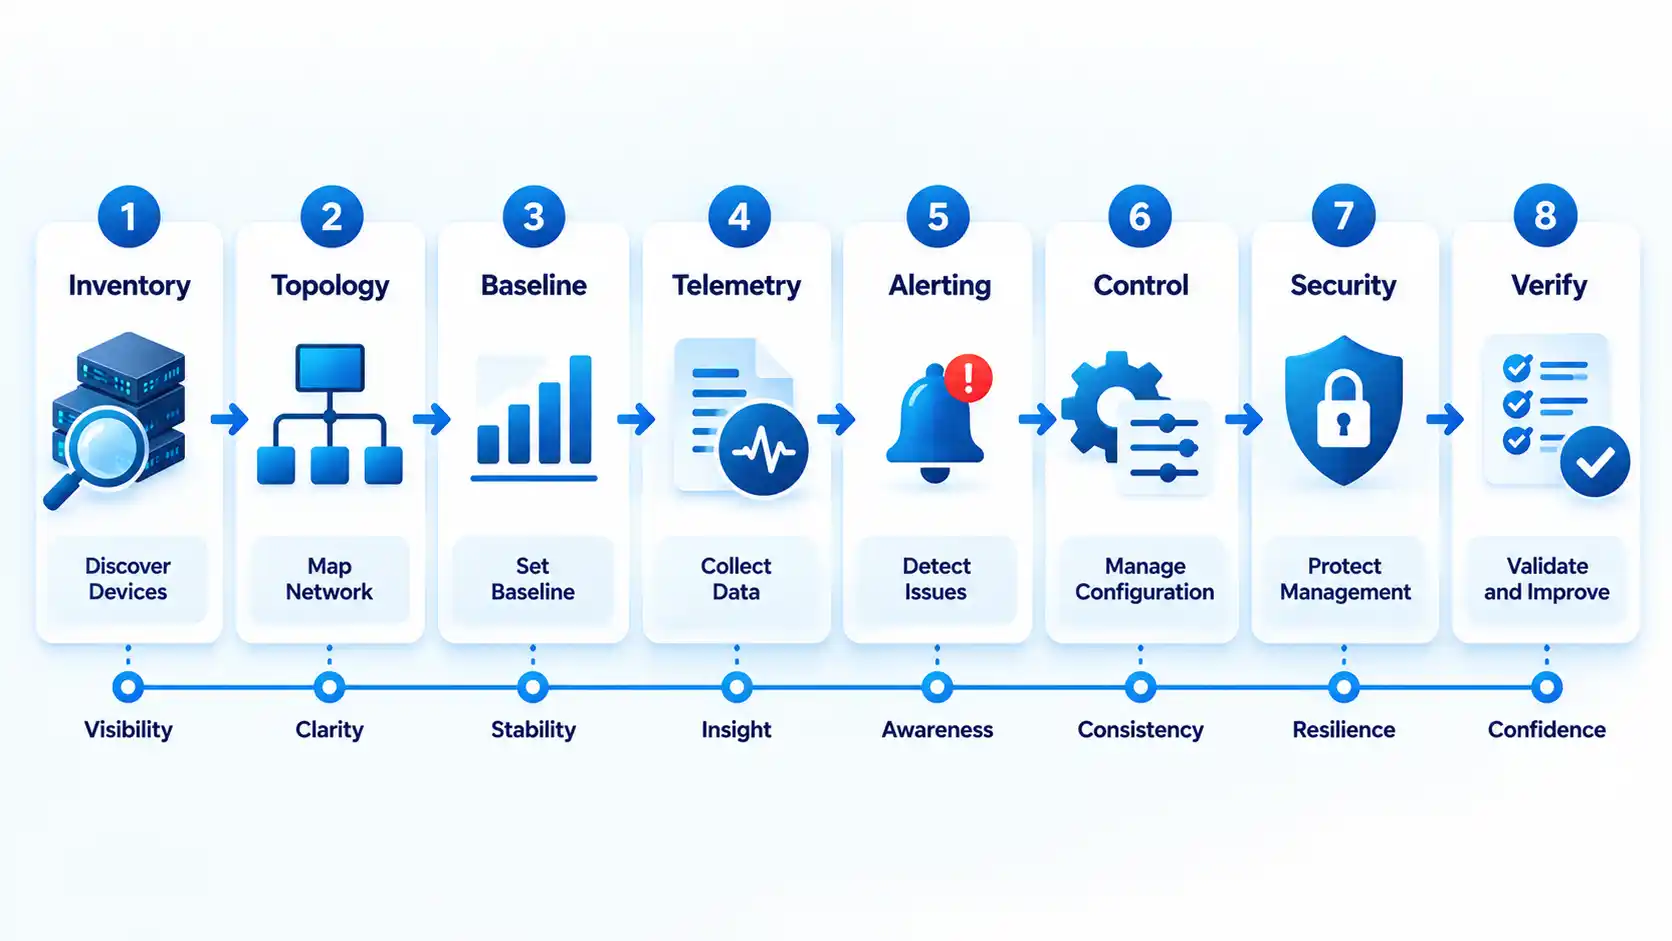
A practical network-management program can start small, but the steps should follow a deliberate order. Establish what exists and what matters before tuning alerts or automating changes.
- Build an accurate inventory and topology. Identify the devices, interfaces, network segments, sites, services, software versions, and important dependencies you are responsible for. Assign ownership where possible. Without a dependable inventory, alerts and changes can be attached to assets nobody understands or manages.
- Establish baselines and service priorities. Identify the business-critical applications, sites, links, and infrastructure components first. Observe normal operating ranges for relevant metrics and note predictable peaks. Baselines help separate ordinary variation from conditions worth investigating.
- Centralize the telemetry you actually need. Collect the SNMP data, logs, flows, streaming telemetry, API data, and other signals that support specific operational decisions. Avoid enabling every possible data source before deciding who will use it and what question it answers.
- Define actionable alerts and escalation paths. Prioritize alerts by likely service impact and urgency. Correlate related events where the platform permits it, suppress known noise, and document who should respond to critical conditions. An alert that nobody owns is only another notification.
- Put configuration changes under control. Back up important device configurations, document approved changes, retain useful version history, and make rollback possible before deploying higher-risk changes. Record enough context to connect a later incident with a recent configuration change.
- Secure the management plane. Restrict administrative access, use encrypted management protocols where supported, protect credentials and configuration archives, centralize relevant logs, and apply appropriate authentication and authorization. Cisco’s secure-operations guidance recommends protecting management-plane access and using secure management protocols where possible.
- Automate repetitive work carefully. Start with deterministic tasks whose expected result is easy to verify, such as standardized configuration checks or controlled updates. Add validation, permissions, logging, and rollback rather than allowing automation to make unrestricted changes. A faulty automated change can propagate across multiple devices quickly, so the controls around the workflow matter as much as the automation itself.
- Verify outcomes and refine the baseline. After a deployment, incident, or remediation, confirm that the affected service is actually healthy. Check the relevant metrics, user experience, configuration state, and alerts. Update thresholds, documentation, or procedures when the event reveals that the previous baseline or workflow was incomplete.
Common Network Management Failure Modes
Network-management problems often come from process weaknesses rather than a complete lack of tools. The symptoms below can help narrow down where the operating model needs attention.
Devices keep appearing in incidents that nobody can identify or assign.
The inventory is probably incomplete or lacks ownership information. Reconcile discovered devices with the organization’s maintained inventory, record the device role and location, and assign an owner or responsible team. Discovery without ownership gives visibility but not accountability.
Operators receive so many alerts that important events are easy to miss.
Review noisy thresholds, duplicate events, dependency relationships, and conditions that do not require action. Prioritize alerts by service impact and urgency. Where supported, correlate downstream symptoms with the upstream failure that caused them.
Performance alerts trigger frequently even though users report no problem.
The thresholds may not reflect normal behavior for that device, site, or service. Compare alerts with historical baselines and user-impact signals, then tune thresholds according to the role of the resource rather than applying one value everywhere.
A network problem appears immediately after routine maintenance.
Check the configuration and software changes made during the maintenance window, compare them with the previous approved state, and roll back the specific change when the evidence points to it. Strengthen the change process if configuration history or rollback data is missing.
The team cannot tell who changed an important device setting.
Administrative authentication, authorization, logging, or change tracking may be insufficient. Centralize administrative identity where appropriate, record privileged activity, protect the logs, and connect configuration history to individual changes rather than relying on shared accounts.
Different monitoring tools report symptoms but nobody can see how they relate.
The environment may lack shared topology or correlation context. Establish common asset identifiers and service dependencies, then integrate or correlate the signals that answer the same operational question. Adding another dashboard without shared context is unlikely to address that gap.
Automated changes occasionally create larger outages than manual changes did.
Reduce the automation scope and add pre-change validation, permissions, test conditions, post-change verification, logging, and rollback. Automate predictable operations first rather than allowing workflows to make broad changes without confirming the resulting network state.
The platform collects enormous amounts of telemetry, but incident resolution has not improved.
Map each data source to a concrete operational question, alert, report, capacity decision, or diagnostic workflow. Reduce collection that has no defined consumer or purpose, then improve the quality and context of the signals operators actually use.
How to Tell Whether Network Management Is Working
A functioning network-management practice should produce observable operational outcomes. It is not enough for the monitoring server to be online or for dashboards to contain data.
Verify the result
- Critical network assets are discoverable, documented, and assigned to a responsible team or owner.
- Operators can see the important relationships between sites, devices, links, and services rather than treating every alert as an isolated event.
- Alerts identify conditions that someone can act on and distinguish high-impact problems from routine noise.
- Important configuration changes can be traced to a known change and, where appropriate, restored to a previous approved state.
- Historical performance and capacity trends are available for critical services instead of relying only on current status.
- Administrative access to network-management interfaces is restricted, authenticated, and sufficiently logged for the organization’s operating model.
- After a change or incident, the team checks actual service health rather than assuming that completing the technical task means the problem is resolved.
Final Takeaway
Effective enterprise network management is not a single monitoring product or a periodic maintenance task. It is a continuous operating discipline that combines visibility, controlled configuration, fault diagnosis, performance management, security, and verification.
A practical foundation is to know what you operate, identify which services matter, collect signals that answer real operational questions, control changes, protect administrative access, and verify the result of significant actions. Automation and richer telemetry can extend that foundation, but they are most useful when inventory, ownership, and operating processes are already dependable.

💬 Comments