Treat it as a supervised execution assistant. You pick the instrument, you set the size ceiling, you define the stop, and you decide at the end whether the thing behaved. No backtest and no demo result tell you the strategy will make money. They tell you whether the software does what its documentation claims on your broker, with your settings.
Quick Take
- A forex robot means a MetaTrader Expert Advisor, written in MQL4 for MT4 or MQL5 for MT5, that automates analysis and order handling under fixed rules.
- Read the sizing logic before you read the marketing. Multiplier, averaging and grid-step inputs can produce a calm equity curve that conceals ruin risk.
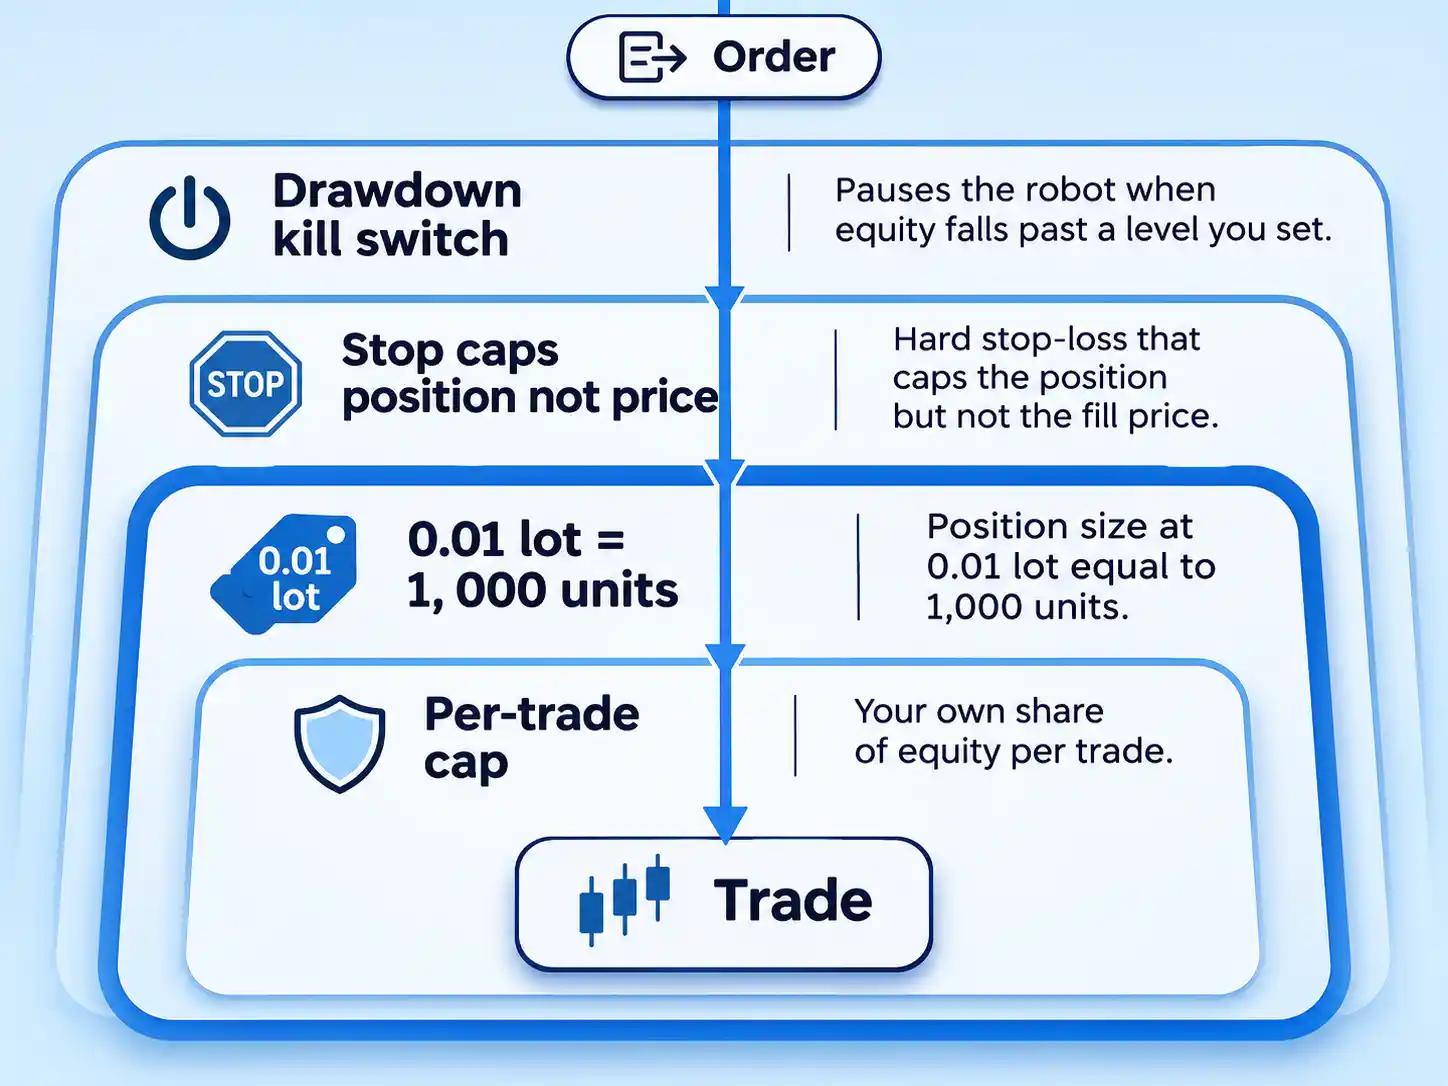
- Three settings bound the damage: a micro-lot position size of 1,000 units, a hard stop-loss enforced by the robot, and a drawdown ceiling you act on.
- Run a backtest on real tick data, then a 30-day demo forward test on live prices. Both stages cost time, not capital.
- A clean demo proves the robot executes your rules. It does not forecast returns, and it is a minimum bar rather than a green light.
What you are actually installing
MetaQuotes, the company that builds MetaTrader, describes Expert Advisors as programs developed in MQL4 and used to automate analytical and trading processes. They can run analysis and place trades on any symbol or period, whether or not the corresponding chart is open. The lifecycle is mechanical. Attaching the program to a chart starts it, and it begins executing on the next incoming tick. Removing it from the chart shuts it down. Parameters shared by every expert sit in the terminal settings; each expert also carries its own inputs.
MQL is the language. MT4 compiles MQL4; MT5 compiles MQL5 into what MetaQuotes calls executable EX5 code. You will usually receive the robot already compiled, which means you are configuring someone else’s program and cannot see the source. That raises the value of the screening step later in this guide.
Two parts of any Expert Advisor deserve separate attention. The entry logic decides when to trade: an indicator family that reacts to moving-average crosses and oscillator levels, or a price-action family that reacts to breakouts and candle structure. The position-sizing logic decides how much goes in. Beginners judge the first and get wrecked by the second, because entry rules are visible in the marketing while sizing rules hide in an inputs tab.
One distinction prevents a lot of confusion downstream. An indicator draws analysis on a chart and places no orders. An Expert Advisor places orders. A tool that only paints arrows is not what you are testing here.
Screen the robot before you install it
Martingale is the architecture to understand first. In its classic form the position doubles after every loss, on the theory that one eventual win recovers everything and leaves the original profit. EBC’s research desk frames it precisely: martingale is a position-sizing system, not an entry strategy. It says nothing about when to trade or why price should reverse. Attach it to a weak entry rule and the entry stays weak while the losses concentrate into a later and much larger position.
The failure mechanism is structural. The model assumes unlimited capital, and a real account has none. Capital.com’s educational page on the technique is blunt that automation does not reduce the risk, and that automated martingale programs have historically produced significant losses when markets trended strongly. The same page states the approach is generally unsuitable for retail traders and should not be used or tested with live funds. Investopedia’s entry on the martingale system notes the further constraint: exchanges and brokers cap trade size, so the doubling sequence eventually hits a wall you cannot climb.
Grid methods work the same way underneath. Orders sit at fixed intervals above and below a base price, and the against-trend variant keeps adding as price runs away. Investopedia’s worked EUR/USD example shows a defined stop capping the risk at a fixed number of pips per side, and its warning is direct: without stop-losses, grid trading can produce large losses. Practitioners often cap the grid at a small number of orders for exactly this reason. EBC adds the detail most beginners miss — a grid can conceal martingale exposure when each new addition is larger than the one before it.
Capped variants are not a rescue. EBC’s assessment is fair: a smaller multiplier and a maximum number of additions slow the growth and make the maximum loss easier to estimate, but the next winner no longer recovers the full sequence. The position-sizing method has abandoned the feature that made it attractive. Judge a capped version exactly as you would any other sizing rule.
Scan the inputs and the description for these signals before you attach anything:
- Input fields named for a multiplier, lot exponent, averaging step, grid distance or maximum order count.
- A description promising a high percentage of winning trades alongside an unusually small drawdown.
- No stop-loss input at all, or a stop-loss described as optional.
- A published equity curve that steps upward in a nearly straight line with no visible flat periods.
A near-straight curve is the tell. It is what you get when most losing sequences end before reaching the extreme stages, and when the sample is too short to contain the trend that breaks the system.
Before you start
Assemble the pieces first, because a half-built test produces a half-trusted result.
Prerequisites
- An MT4 or MT5 terminal that matches the robot: MQL4 programs run on MT4, MQL5 programs on MT5.
- A demo account at the broker you actually intend to fund, on the account type you would really open.
- The compiled Expert Advisor file and whatever documentation exists for its inputs.
- Real tick history downloaded for the symbol and period you plan to test.
- A hosting decision: a VPS, or a machine you can keep awake and online for a month.
- A log template you will actually fill in daily, even on days when nothing happens.
Run the test at the broker you intend to fund. Spread, commission, swap, minimum stop distance, contract size and leverage limits all change the outcome, so a configuration validated elsewhere is only a starting point. Open the demo account at that broker. If you want a starting point, Weltrade’s demo trading account is one option, and every platform-level step below applies unchanged at any MetaTrader broker.
Stop here and walk away if any of the following is true. You would fund the live step with money you need for rent, food or debt repayments. You would borrow to fund it. You want an income stream that runs without you checking it. Or you already know you will skip the demo because a backtest looked good. MetaTrader automation rewards patience and punishes impatience in a way that shows up directly in the account balance.
Install and attach the robot
The install is the well-documented part, and it is worth doing slowly because every later stage depends on the file being where the terminal expects it.
- Place the compiled file in the Experts folder.In the terminal, open File and then Open Data Folder. Navigate to MQL5 and then Experts on MetaTrader 5, or MQL4 and then Experts on MetaTrader 4, and copy the robot’s file into that folder.
The Strategy Tester and the Navigator both read from this location. A file sitting on your desktop or in a downloads folder is outside the platform’s data folder, so the tester will not list it; placing the compiled file in the Experts folder is what makes it available.
Close the folder, right-click Expert Advisors in the Navigator panel and choose Refresh. The robot should now appear in the tree under that heading.
- Open the demo account’s chart for your intended symbol and timeframe.Log in to the demo account, enable the symbol in Market Watch, and open a chart using the instrument and timeframe the robot is designed for.
MetaQuotes documents that an expert can act on any symbol or period regardless of which chart is open, and that once attached it begins executing on the next incoming tick.
Confirm the chart is live and prices are ticking before you continue. A frozen chart means a connection problem, and any test that follows will be worthless.
- Attach the robot to the chart.Drag the expert from the Navigator onto the chart, or right-click it and choose the attach option. A properties window opens with the robot’s own inputs.
MetaQuotes’ documentation is specific on what happens next: the expert begins executing on the next incoming tick. Nothing runs between ticks, so a quiet symbol on a weekend produces no activity at all.
The chart should show the expert’s name and its status indicator in the corner. If the name is missing, the attachment failed and you should repeat this step rather than assume it worked.
- Enable automated trading at both levels.MetaQuotes sets parameters common to all experts in the client terminal settings, and each expert carries its own settings on top of that. Turn on the terminal’s automated-trading switch, then reopen the expert’s properties and confirm that automated trading is permitted for this specific program.
This two-level design trips up almost every first-time user. The terminal can allow automation while the individual expert is still blocked, and the chart will show the robot as loaded and idle.
The status indicator should now read as active rather than blocked. If it does not, the switch you missed is the one inside the expert’s own properties.
Configure the inputs that bound the damage
Sizing arithmetic you can check beats a setting you copied from a forum. A micro lot is 1,000 units of the base currency, which is one hundredth of a 100,000-unit standard lot. On EUR/USD, one pip of movement on a micro lot is worth about ten cents.
Investopedia’s worked sizing example makes the relationship concrete. Take a $1,000 balance and a 2% risk limit per trade, which puts $20 at risk. Place a 50-pip stop-loss. At the source’s pip value, one micro lot’s loss over that stop distance is only a small part of the $20 risk, so the position size lands at four micro lots. Change the stop to 100 pips and the same $20 risk buys two micro lots. The risk stays fixed; the size flexes.
Treat a percentage like that as a ceiling you do not cross, not a target to reach. The figure you choose is yours, and it should be small enough that five consecutive losses leave the test running.
| Setting | Starting value for the trial | Why it matters | What happens without it |
|---|---|---|---|
| Position size | 0.01 lots, either fixed or derived from the risk calculation | 1,000 units keeps a 50-pip stop affordable and makes the arithmetic readable | A default of 0.1 or 1.0 multiplies every loss by ten or a hundred |
| Risk per trade | Your own percentage ceiling, applied through the sizing calculation | Sizing from equity keeps losses proportional as the balance moves | A fixed lot size ignores the account and drifts toward oversized trades |
| Hard stop-loss | Mandatory, set inside the robot’s inputs | A stop becomes a market order and guarantees execution, not price | Without one, the next gap decides the size of your loss |
| Maximum open positions | One during the trial | Isolates a single robot’s behaviour on a single symbol | Correlated positions stack into one large directional bet |
| Drawdown ceiling | A level you define in writing before the trial starts | Converts a bad run into a pause for review | A losing streak runs until margin stops it |
The stop-loss deserves a separate warning because it is the setting beginners trust most and understand least. Investopedia’s explanation of stop orders is unambiguous: the stop becomes a market order at the trigger price, and it guarantees execution, not price. If the market gaps through your level, the fill lands wherever the next available price sits. The stop caps the position. It does not cap the fill.
Backtest first, in the Strategy Tester
Three stages get confused constantly, and they answer different questions. A backtest replays historical data through the robot’s code with fixed parameters. A demo forward test runs the same robot on live prices with no capital at risk. A micro-live account runs it with real money at the smallest size the broker allows. Only the first two belong in the zero-risk phase.
Run a defensible backtest
MetaQuotes defines testing as a single run of an expert with fixed parameters on historical data, and optimization as multiple runs with different parameter sets. A backtest that means anything starts with the data, not the settings. The walkthrough below uses the MetaTrader 5 tester; the same ideas apply on MT4, where the windows and history tools differ.
- Select the robot and mirror the account in the tester.Open the Strategy Tester from the View menu. Choose the expert, the symbol, the timeframe and the date range, then set the deposit and leverage to match the demo account you will trade.
A test run on a deposit ten times your real balance produces position sizes you could never open, and drawdown figures that mean nothing. The specification button next to the timeframe shows contract size and margin requirements if you need to check them.
The tester should now show the expert loaded with your parameters in the settings pane. If the field is empty, the file is not in the Experts folder.
- Download real tick history for the symbol.Open the Symbols window, select the instrument, open the Ticks tab, set the range and request the download.
The history that arrives automatically with a chart is incomplete. Without real ticks, the tester rebuilds prices between minute bars by formula, and a robot with tight stops or scalping logic will show results it could never repeat in the market.
The download is finished when the ticks tab shows data covering your test dates rather than a partial range.
- Set the modelling mode, spread and delay honestly.Choose the every-tick-based-on-real-ticks mode, apply a realistic spread for the account type, and set a non-zero execution delay.
Zero latency describes a market that does not exist. A non-zero delay gives a more realistic read on how order speed affects the result, particularly for short holding periods.
The settings panel should show your chosen spread and delay values before you start, not the defaults.
- Run the test and keep the report.Start the run and wait for completion. Save the report, because you will compare it against the demo results later.
Run the same test with costs applied — spread widening around news, commission and swap — before you trust a positive result. A strategy that only works at zero cost does not work.
The results tab should populate with a completed trade list and a summary. An empty trade list means the robot never fired, which is a configuration fault rather than a verdict on the strategy.
- Read the report in a fixed order.Check history quality first, then profit factor, then drawdown on both balance and equity, then trade count, then the shape of the curve.
Reading metrics in that order prevents the common mistake of admiring a profit factor that was computed on a column of gaps. For a deeper treatment of data selection and period length, see testing a strategy on historic price data.
A report worth acting on shows dense history, a trade list long enough to mean something, and a curve you can explain.
What each metric is telling you
History quality is the percentage of correct one-minute data the tester used to reconstruct your test period, per MetaQuotes. Gaps and malformed bars count against it. The tester splits the period into intervals and colours them by quality, with red marking any interval below 50% correct data. A report with large red stretches has silently invented part of the price action.
Profit factor is gross profit divided by gross loss. Exactly 1.0 means the two are equal; below 1.0 the test lost money across the period. This is arithmetic, not opinion. A very high figure on a small number of trades is a question about sample size and overfitting, and worth treating as a warning rather than a triumph.
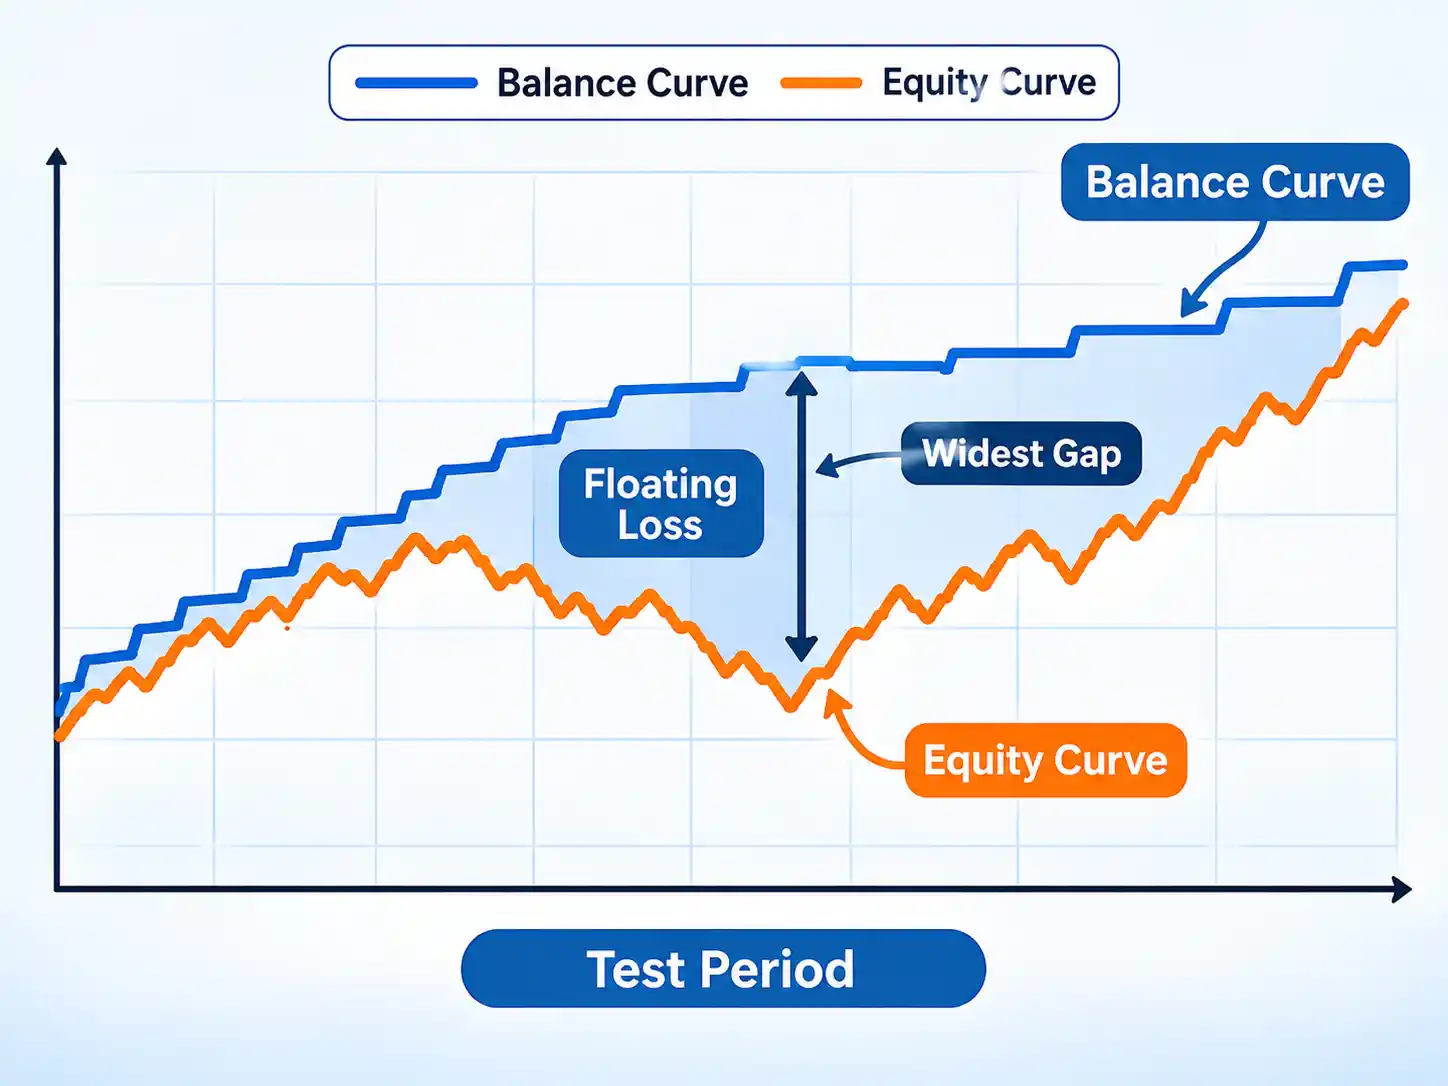
Drawdown is reported on both balance and equity. Balance drawdown measures closed-trade losses. Equity drawdown measures the worst floating loss while positions were still open, which is the number that triggers margin calls. A wide gap between the two means the robot spends long stretches underwater, and one broker’s published guidance flags that gap as a sign of floating losses the balance curve hides. See how the two curves separate in the chart below.
Trade count decides whether any other number deserves attention. A few dozen trades spread across several years is a sample too thin to distinguish skill from luck, and one broker’s education page makes the same point about 20 to 30 trades over a multi-year period. If the sample is thin, lengthen the period or add symbols before you believe the profit factor.
Overfitting is the quiet killer. A parameter set tuned until the curve looks immaculate has usually been fitted to a specific run of prices. The practical check is to nudge one input slightly — an RSI period from 14 to 13 or 15, for example — and rerun. If the result collapses, the settings were fitted to the sample rather than to a market behaviour.
The 30-day forward test on demo
A backtest is one run on history. A demo forward test runs the same robot on live prices with your own settings and no capital exposed, and it is the only stage that can show you execution. Order handling, stop-loss and take-profit placement, spread behaviour at the open, connection stability and terminal behaviour across a weekend all appear here and nowhere else.
Thirty days is a planning window, not an evidentiary standard. Choose it because it forces a decision on a date instead of drifting into indefinite observation, and because one broker’s published guidance suggests a few weeks of demo running. It is long enough to surface technical faults. It is not long enough to prove an edge.
The daily check takes five minutes
- Every open position carries a stop-loss at the level the rules demand.
- The lot size on new orders has not drifted from your configured value.
- The terminal is running and the expert’s status indicator still reads active.
- The journal shows no rejected orders, invalid stop errors or reconnection warnings.
- The number of open positions matches what the configuration should allow.
Once a week, do the harder pass. Compare intended entry price against filled price and write the slippage down. Count missed and duplicated orders. Check whether results still resemble the backtest for an equivalent stretch of market conditions. Then note anything you cannot explain in a sentence.
News windows are your call
Spread widening, slippage and volatility spikes cluster around high-impact economic releases, and a robot with a tight stop is exposed to all three at once. Pausing automated trading across those windows is a discretionary control you may choose during the test. If you do, decide the rule before the trial starts, log every pause, and subtract paused time when you count the days. Changing the rule mid-test turns the record into an argument.
Why a laptop is the wrong host
Consumer laptops sleep, lose power, drop Wi-Fi and freeze terminals. Every one of those events takes the robot off the market with positions open and no stop management. OANDA’s automated-trading guidance recommends a Virtual Private Server for round-the-clock reliability against exactly these failures, and treats latency and jitter as operational risks rather than edge cases. That is expert practice rather than a measured outcome, and it still points the right way.
A VPS is a remote machine that keeps the terminal running when your laptop is closed. If you cannot arrange one, then arrange a machine that stays awake and plugged in, and accept that the test will probably contain at least one unexplained gap. Log every gap when it happens.
Day 30 and the decision you make
Convert the log into one of three outcomes. Guessing at the end of a month is how clean tests turn into expensive lessons.
| Outcome | What the log has to show | Action |
|---|---|---|
| Pass | Every position carried a stop; lot size never drifted; profit factor held above 1.0 across a trade count you consider meaningful; equity drawdown stayed close to balance drawdown; fills landed near intended prices; no unexplained anomalies | Proceed to the smallest live size with the same inputs, and keep the demo running in parallel for comparison |
| Extend | Trade count too thin to judge; one anomaly you cannot explain; demo results drift from the backtest without anything being visibly broken | Another 30 days on identical settings. Do not retune to improve the picture |
| Reject | A stop-loss was missed or missing; lot size drifted; positions duplicated; equity drawdown ran far beyond balance drawdown; profit factor below 1.0 on a decent sample; the robot stopped running without raising an alarm | Remove from the chart, delete the file, and start the screening process on something else |
Profit factor and win rate measure different things, and one of them is nearly useless alone. Win rate counts how many trades closed in profit. It tells you nothing about size. A martingale robot can close most of its sequences in profit and lose the account on the one that runs, which is precisely why its published record looks so calm. Profit factor weighs the money won against the money lost, so it registers the trade that erases a month of small gains.
Read them together. A high win rate with a profit factor barely above 1.0 is a robot collecting small wins while sitting on large losses. A modest win rate with a healthy profit factor is a robot whose winners pay for its losers. Neither number, at any value, forecasts what happens next month.
Failure modes, rollback and recovery
Most demo tests fail in a small number of recognisable ways. Diagnose the symptom before you touch a setting, because retuning during a test destroys the record you spent a month building.
The backtest ran but no trades appeared
The robot never fired. Check that the symbol is enabled in Market Watch and that the test period actually contains the data the entry rules need. Some experts require history before the start date to warm up an indicator. Confirm the expert loaded rather than an empty slot, then extend the start date backwards and rerun.
History quality shows red intervals across part of the test
The tick data is incomplete for those dates, so the tester rebuilt prices by formula. Request real ticks for the full range, or shorten the period to one the archive covers. MetaQuotes marks any interval below 50% correct data in red — treat those stretches as absent rather than as evidence. (Metatrader5)
The backtest was excellent and the demo is flat
Two usual causes. The parameters were fitted to the historical sample, which the single-parameter nudge test will reveal. Or the demo account’s spread, commission and swap differ from the test assumptions. Rerun the backtest using the demo account’s actual costs before concluding anything about the strategy.
A demo position opened with no stop-loss attached
Either the robot manages stops internally and failed, or the broker’s minimum stop distance rejected the level. The journal usually records an invalid stops error. Flatten the position manually first, then check the minimum distance and the robot’s stop logic before reattaching. A robot that opens unprotected positions has failed the test regardless of its profit factor.
Duplicate positions appeared on the same symbol
The expert is attached to more than one chart, or a second terminal is logged into the same account. Remove the extra attachment and close the surplus positions. Then add a check to your daily routine that counts open positions against the configured maximum.
The terminal disconnected over the weekend and positions sat unprotected
This is the failure a VPS exists to prevent. If it happens, record it, note the market gap at the Monday open, and treat the week as contaminated evidence. Before the next attempt, either move the terminal to a host that stays online or accept the risk explicitly in your log rather than pretending it will not recur.
When something breaks, work the recovery ladder in order. Remove the expert from the chart first so nothing new fires. Flatten any open positions manually. Restore the last inputs you know were working. Then rerun the backtest and restart the demo clock. Skipping the first step is how a diagnostic session becomes an unplanned live trade.
After the demo passes, and who this suits
Passing the day-30 gate opens the smallest live step, not the strategy. Keep the expert, the symbol and the inputs identical, and reduce the size to the smallest step available — commonly a single micro lot at 1,000 units. Run the demo alongside it for a few weeks and compare fills. OANDA‘s guidance notes that practice accounts share the live price feed but can diverge when liquidity thins, so the first place you will see execution decay is in your own slippage record on quiet sessions.
This process suits a retail beginner with a small account, time to look at a demo each day, and patience for several weeks of mostly nothing. It suits anyone willing to run a VPS or leave a terminal awake, and anyone who will fill in a log even when the day’s entry is uneventful.
It does not suit a person who wants an income stream that runs unattended. It does not suit someone who will skip the demo because a backtest looked good. It does not suit anyone funding the account with essential savings, borrowed money or a credit line, and that boundary does not move based on how strong the demo record looks.
Leverage limits, margin requirements and broker rules vary by jurisdiction and by account type. The configuration you validate is valid for your broker, your account and your symbol. Re-test before you transfer it anywhere else.
The question you answer at the end
The point of the month is not to find out whether the robot made money on a demo. It is to find out whether the software did what its documentation said, on your broker, with your settings, for thirty days, without a surprise. If the answer is yes — stops honoured, size stable, curve explainable, losses within the ceiling you set — then a single micro lot is a reasonable next step and you will take it with a written record behind you.
If the answer is no, deleting the file costs you a month and nothing else. That is the entire value of the zero-risk phase, and it is worth every uneventful evening you spent checking a chart that did very little.

💬 Comments