The strongest business plans lean on eight kinds of software: BI dashboards, predictive analytics, cloud collaboration, project management, market research, financial management, CRM, and data visualization tools. Each one answers a different planning question, from “what will next quarter’s cash flow look like” to “who is actually buying from us.”
You don’t need every tool on day one. But as you write and test your plan, each category below fills a specific gap that guesswork can’t. Pair these with the other strategies in your plan to build a real competitive edge. For a starting structure, use this simple business plan template as a reference. This list focuses on tools for the planning and forecasting stage specifically. If you’re past planning and want the wider set of software most growing businesses run day to day, our guide to must-have business software covers cloud storage, HR, and cybersecurity tools that sit outside a business plan’s scope.
Quick Take: Best Tool for Each Planning Job
Here’s a fast summary before you read the full breakdown.
| Planning Job | Tool Category | Best For |
|---|---|---|
| Turning past sales data into a clear picture | Business Intelligence (BI) platforms | Spotting trends before you write projections |
| Forecasting what happens next | Predictive analytics software | Testing “what if” scenarios in your plan |
| Writing the plan with a team | Cloud-based collaboration platforms | Co-editing forecasts and strategy docs in real time |
| Staging the rollout | Project management software | Turning plan milestones into tracked tasks |
| Proving there’s a market | Market research platforms | Backing up your market-size claims with real data |
| Modeling the numbers | Financial management software | Building the financial section investors will scrutinize |
| Sizing your customer base | CRM software | Showing traction and customer behavior patterns |
| Presenting the plan | Advanced data visualization tools | Turning dense numbers into charts a reader trusts fast |
The 8 Tools, Explained
By using these tools while you plan, not just after you launch, you can back up every claim in your business plan with real data instead of guesswork.
1. Business Intelligence (BI) Platforms
A business intelligence (BI) platform pulls data from different parts of your business into one place. It then turns that data into dashboards, charts, and graphs you can actually read. For business planning, this matters most in the research section of your plan. Instead of guessing at your current sales trends or busiest months, you can show real numbers.
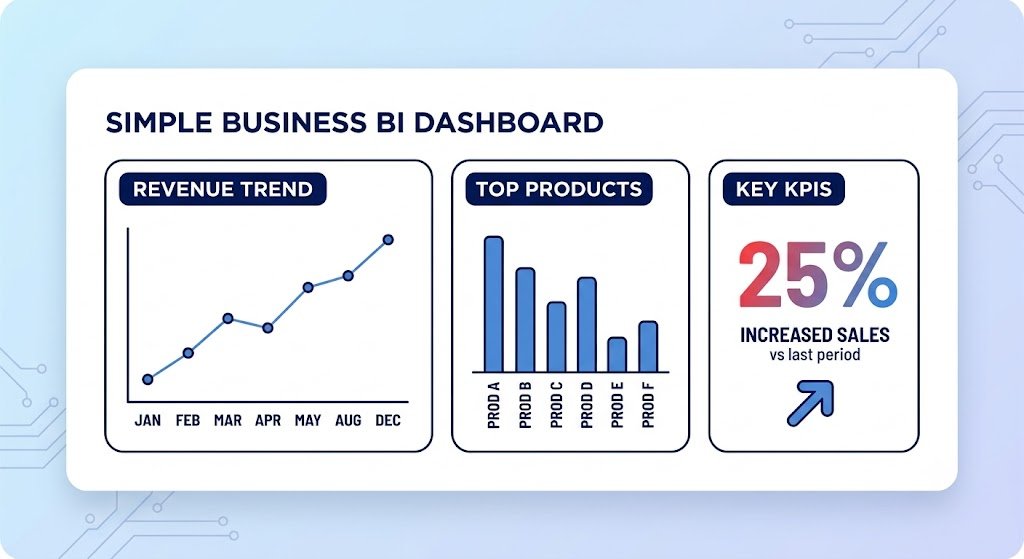
Power BI, Tableau, and Qlik Sense are the current market leaders in this space, according to Gartner’s analytics and BI platform rankings. If you want outside help deciding which BI setup fits your business, firms like elsewhen AI consultancy can assess your needs and apply AI tools without adding extra staff.
Best for: Founders who already have sales or operations data and need to turn it into evidence for their plan.
Real limitation: A BI dashboard is only as good as the data you feed it. If your records are messy or split across five spreadsheets, expect to spend real time cleaning data before the dashboard says anything useful. You can learn more about the data analysis process if this step is new to you.
2. Predictive Analytics Software
Predictive analytics software looks at your past data and uses it to guess what happens next. It uses statistics and machine learning to spot patterns, then applies those patterns to future events. In a business plan, this is the tool behind your “what if sales grow 20% instead of 10%” section.
IBM SPSS is one of the better-known tools built specifically for this kind of forecasting, alongside options like SAS and RapidMiner. These tools help you build sales forecasts, plan inventory levels, and flag risks before they show up in real numbers.
Best for: A plan with more than a year of sales history behind it. You can pressure-test your forecast section with the tool’s help instead of a single hopeful guess.
Real limitation: Predictive tools need a real dataset to work from. A brand-new business with no sales history won’t get much value here yet — early-stage founders are usually better served starting with market research instead (see #5 below), then adding predictive tools once they have a few quarters of real data.
3. Cloud-Based Collaboration Platforms
Writing a business plan is rarely a one-person job. Co-founders, advisors, and early hires all need to add sections, leave comments, and see the latest version. Cloud platforms like Google Workspace and Microsoft 365 solve this by keeping one shared, always-current copy of your plan online.
Everyone can edit the same document at the same time from any location. No one emails around five different file versions named “plan_FINAL_v3.” Clear, frequent communication between team members during the planning process leads to a sharper, more realistic plan.
Best for: Any team of two or more people writing a plan together, especially across different locations.
Real limitation: These platforms need a stable internet connection to work well. If you’re drafting offline or somewhere with spotty Wi-Fi, keep a local backup so you don’t lose your work.
4. Project Management Software
Once your plan is written, someone has to actually execute it. Project management software turns each milestone in your plan — hiring your first employee, launching your website, hitting your first revenue target — into a task with an owner and a deadline.
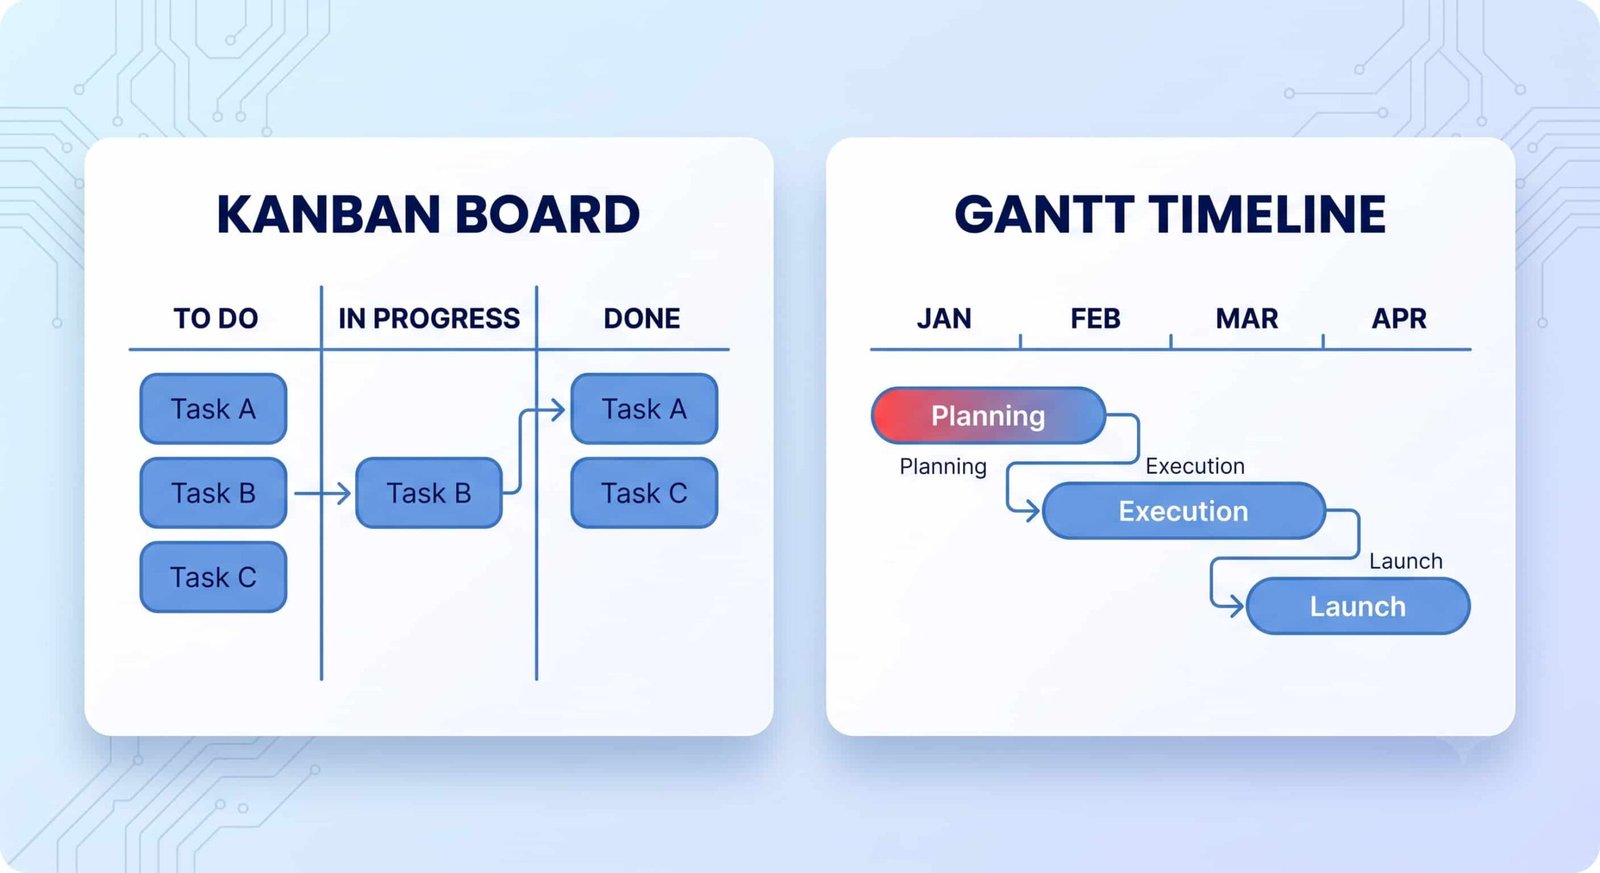
Jira, Trello, and Asana are the three most common picks, but they fit different teams. Jira suits agile, technical teams; Trello suits small teams that want a simple visual board; Asana sits in the middle with Gantt-style timelines and workload views, according to a side-by-side comparison of the three tools. All three use Kanban boards, a visual layout where tasks move through columns like “To Do,” “In Progress,” and “Done.”
Best for: Turning your plan’s rollout timeline from a paragraph into tasks your team can actually check off.
Real limitation: A board is only accurate if people update it. If your team forgets to move cards or mark tasks done, your timeline will look on-track when it isn’t.
5. Market Research Platforms
Every business plan needs a section proving there’s real demand for what you’re selling. Market research platforms give you the survey data to back that claim instead of relying on assumptions.
SurveyMonkey and Qualtrics are the two most widely used tools in this space. SurveyMonkey is built for speed and ease of use, while Qualtrics offers deeper, more advanced research features aimed at larger organizations, per a direct comparison of the two platforms. Both let you survey your target audience directly and export the results into your plan.
Best for: The market analysis and customer validation sections of your plan — the parts investors and lenders question first.
Real limitation: A survey is only as reliable as the people who answer it. A small, unrepresentative sample can make a weak idea look strong on paper. Aim for enough responses from your actual target customer, not just friends and family. For a deeper approach to sizing your market, see this guide to market research for startups.
6. Financial Management Software
The financial section is often the most scrutinized part of any business plan. Financial management software helps you build it on real numbers instead of rough estimates.
QuickBooks, Xero, and FreshBooks are the three most common choices for small businesses. QuickBooks tends to fit US-based businesses that want built-in payroll, Xero works well for teams that need multi-currency support, and FreshBooks suits freelancers and service businesses that invoice often, according to a comparison of the three platforms. Each one tracks expenses, manages invoices, and generates the financial reports your plan’s numbers should be based on.
Best for: Building realistic cash flow, expense, and revenue projections instead of copying numbers from a competitor’s public filings.
Real limitation: These tools show you the numbers, but they don’t tell you what to do with them. You (or an accountant) still have to interpret the results and decide what’s realistic. For help turning raw numbers into a forecast, see our guide to financial forecasting for small businesses.
7. Customer Relationship Management (CRM) Software
CRM software is a system that stores and organizes every interaction you have with customers and leads in one place. It documents who you’ve talked to, what they asked for, and what happened next, according to IBM’s overview of CRM systems.
For a business plan, CRM data does two jobs. First, it proves traction — real numbers on leads, conversions, and repeat customers carry more weight than a hopeful sentence. Second, it helps you write a more accurate customer section, because you’re describing real behavior instead of a guess. Tools like NetHunt show how a lightweight CRM can help you manage leads without hiring extra sales staff.
Best for: Any plan that claims existing traction or repeat customers — the CRM is your evidence.
Real limitation: A CRM holds sensitive customer data, so security matters from day one. Review basic steps to protect customer data before you start collecting it, not after something goes wrong.
8. Advanced Data Visualization Tools
Once your numbers are solid, you still have to present them clearly. Advanced data visualization tools turn dense spreadsheets into charts a reader can understand in seconds, instead of a wall of numbers they’ll skim past.
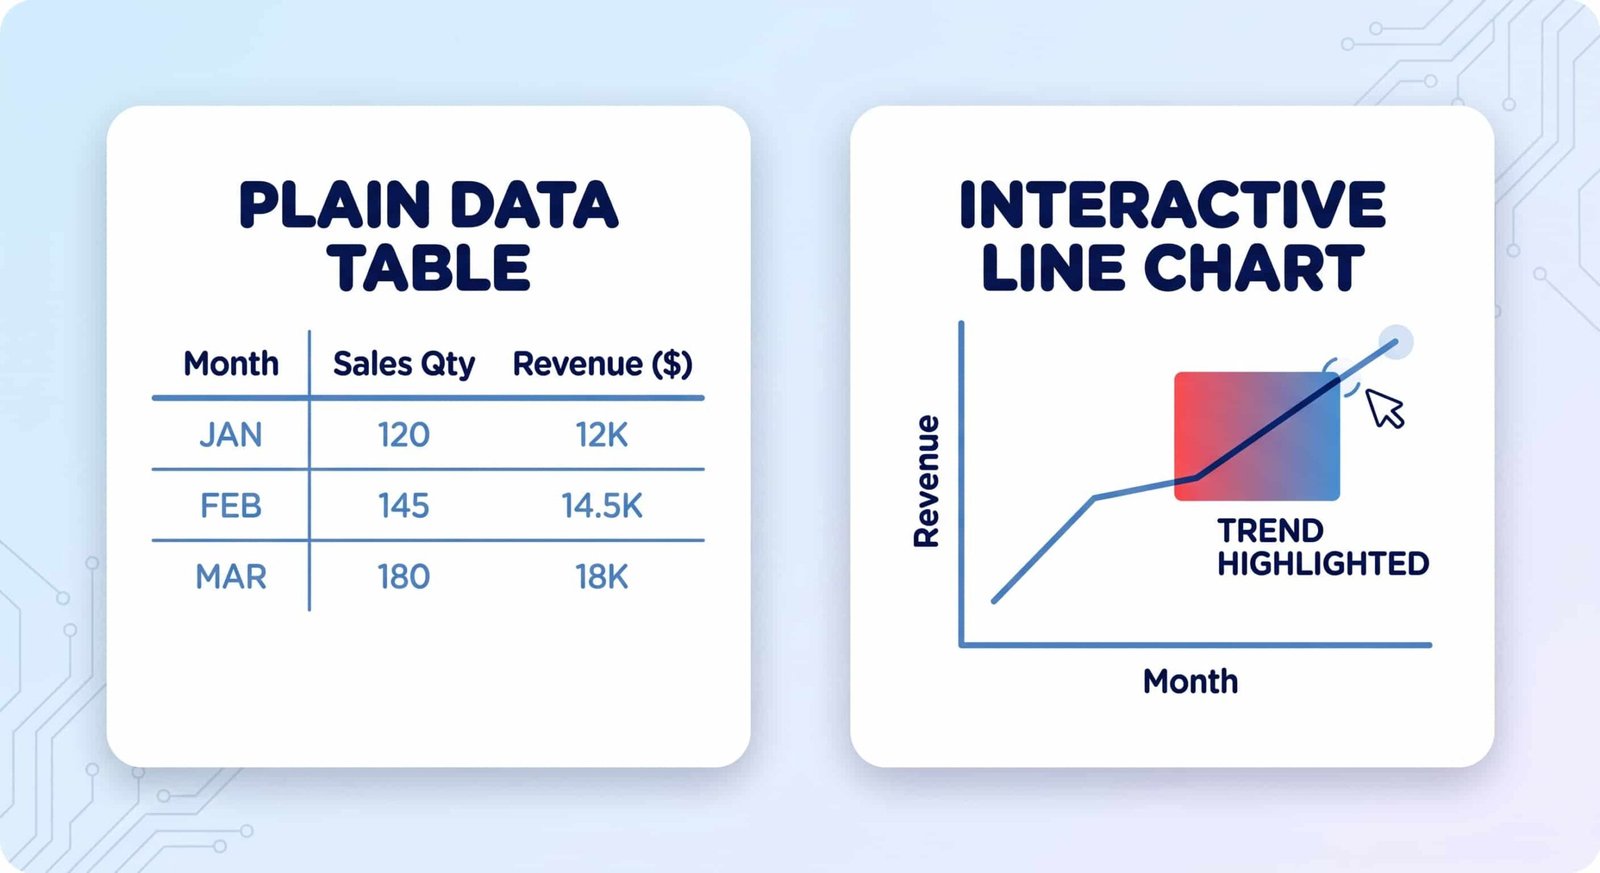
Tableau and Microsoft Power BI (already useful for BI dashboards in tool #1) can also build these presentation-ready charts. D3.js is a more advanced option for teams that want fully custom, interactive visuals, though it requires some coding knowledge to use.
Best for: The section of your plan investors or lenders will actually look at first — usually the market size chart or the revenue projection graph.
Real limitation: A flashy chart can’t fix weak underlying data. If the numbers behind the chart are wrong, a nicer visual just makes the mistake more convincing. For guidance on picking the right chart type for your data, see this overview of data visualization best practices.
How to Choose the Right Mix for Your Plan
You don’t need all eight tools before you write a single word. Match the tool to the stage your plan is at.
If you’re still validating the idea: Start with market research and cloud collaboration. You need proof there’s demand, and a shared space to write the plan itself.
If you have some sales history: Add BI and predictive analytics. You now have real data worth analyzing and forecasting from.
If you’re about to launch or raise money: Add financial management and data visualization. These build the numbers section and make it presentable to lenders or investors.
If you already have customers: Add CRM and project management. These prove traction and help you execute the plan once it’s written.
Key Takeaways
Business intelligence platforms turn your past data into evidence for your plan. Predictive analytics software helps you forecast what comes next, once you have enough history to forecast from. Cloud collaboration keeps your plan current when more than one person is writing it. Project management software turns your plan’s milestones into tracked, owned tasks. Market research platforms prove real demand instead of assumed demand. Financial management software builds the numbers your financial section stands on. CRM software documents real customer traction. Data visualization tools make your strongest evidence easy to understand at a glance.
FAQ
Do I need to buy all eight tools before writing my business plan?
No. Match tools to your plan’s current stage, as outlined above. A pre-revenue idea needs market research and a shared doc more than it needs predictive analytics or a CRM.
Do BI and data visualization tools like Tableau or Power BI require coding skills?
Not for basic use. Both are built with drag-and-drop dashboard builders aimed at non-technical users. Tools like D3.js are the exception — those do require coding knowledge because they’re built for fully custom, code-based visuals.
Can free plans of these tools work for a solo founder?
Often, yes, at least to start. Many of the tools above offer limited free plans for individuals or very small teams. Availability and limits change often, so check each vendor’s current pricing page before you commit to a paid tier.
How do these tools fit into an actual written business plan document?
They feed the plan rather than replace it. Data from BI, market research, and financial tools becomes the evidence behind your market analysis and financial sections. Project management tools then help you execute the plan once it’s written and your team starts hitting each milestone.

💬 Comments